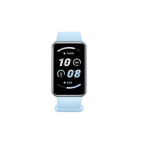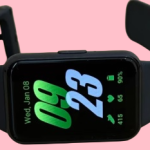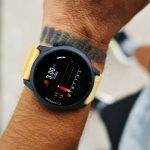

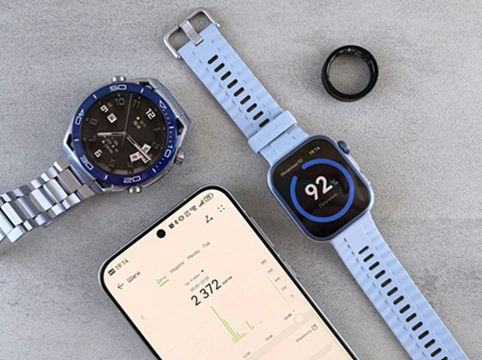
In the modern digital landscape, wellness management has undergone a profound decentralization. For generations, tracking vital physiological signs was a reactive process, restricted to annual clinical check-ups, hospital examination rooms, and bulky, specialized diagnostic machinery. Today, that narrative has fundamentally changed. An ultra-thin, lightweight strip of elastomeric polymer and silicon resting on your wrist now possesses computational capacities that rival early medical monitors.
Modern smart bands and fitness trackers have evolved far beyond basic step counters. They function as 24/7 personal health laboratories, continuously tracking complex internal physiological data. However, the true value of a smart band does not lie in accumulating raw numbers; it lies in your ability to interpret them. Understanding metrics like Blood Oxygen Saturation (SpO2), Heart Rate Variability (HRV), and Sleep Stage Architectures allows you to transform raw data into actionable insights for stress management, athletic recovery, and early illness detection.
This comprehensive guide breaks down the science behind your smart band’s primary health metrics, explaining how they are measured, what the numbers mean, and how to use them to optimize your long-term healthspan.
1. The Science of the Optical Grid: How Smart Bands Read Your Body
Before diving into specific metrics, it is vital to understand the underlying technology that enables a smart band to peek beneath your skin. Almost all wrist-bound biometrics rely on a methodology called Photoplethysmography (PPG).
       [ PPG SENSOR ARCHITECTURE ]

     ┌──────────────────────────────┐
     │  Smart Band Sensor Array     │
     │  [LED Emitter] [Photodiode]  │
     └───────│──────────────▲───────┘
             │              │
     (Emitted Light) (Reflected Light)
             │              │
    =========▼==============│========  <- Skin Surface
             │              │
       ┌─────▼──────────────┴─────┐
       │ Microvascular Bed        │
       │ (Pulsing Blood Vessels)  │
       └──────────────────────────┘
The Principle of Light Absorption
At the back of your smart band, you will see a cluster of flashing lights—typically green, red, and sometimes infrared—paired with sensitive photodiodes. When these LEDs emit light into your skin, it passes through the outer dermal layers and strikes the dense network of microvascular blood vessels underneath.
Blood is a dynamic fluid; every time your heart contracts, a fresh surge of oxygenated blood rushes into your wrists, momentarily expanding the volume of your blood vessels. Between beats, the volume recedes. Because blood absorbs light differently depending on its volume and oxygen content, the photodiode captures the variations in the reflected light. The smart band’s onboard micro-kernels then run these raw light-absorption signatures through complex algorithms to calculate your heart rate, respiratory patterns, and blood oxygen levels.
2. Heart Rate Diagnostics: Checking Your Cardio Baselines
Your heart rate is the foundational engine of all wearable biometric tracking. Smart bands break this metric down into three primary layers: Resting Heart Rate (RHR), Active Heart Rate Zones, and Heart Rate Variability (HRV).
┌────────────────────────────────────────────────────────┐
│               HEART RATE PROFILE BENCHMARKS            │
├────────────────────────────────────────────────────────┤
│ ❤️ Resting Heart Rate│ 60–100 BPM standard baseline.    │
│    (RHR)            │ Lower numbers indicate better    │
│                     │ cardiovascular fitness.          │
├────────────────────┼──────────────────────────────────┤
│ 📈 Active Zones     │ Aerobic, Anaerobic, and Fat Burn │
│                    │ brackets based on your Max HR.   │
├────────────────────┼──────────────────────────────────┤
│ ⏱️ Heart Rate       │ Millisecond variations between   │
│    Variability (HRV)│ beats. High HRV indicates a well-│
│                     │ recovered nervous system.        │
└────────────────────┴──────────────────────────────────┘
Resting Heart Rate (RHR): Your Systemic Baseline
Your Resting Heart Rate is the number of times your heart beats per minute when you are completely at rest, typically measured just before you get out of bed in the morning. For the average adult, a healthy RHR ranges between 60 to 100 beats per minute (BPM). For well-conditioned athletes, this baseline can drop into the 40s or 50s.
- The Trend Metric: A single day’s RHR reading matters less than your long-term trend. If you notice your RHR steadily climbing over three or four days, it is often an early warning sign of physical overtraining, chronic psychological stress, poor sleep accumulation, or an impending viral infection before you feel physical symptoms.
Active Heart Rate Zones: Optimizing Physical Output
When you exercise, your smart band uses your age and baseline data to establish your Maximum Heart Rate (Max HR), usually calculated using the standard formula: 220 – Age. It then maps your physical effort into five distinct operational zones:
- Zone 1 (50-60% Max HR) – Warm-up: Ideal for active recovery and metabolic stimulation.
- Zone 2 (60-70% Max HR) – Fat Burn / Endurance: Builds foundational cardiovascular health and encourages efficient fuel burning.
- Zone 3 (70-80% Max HR) – Aerobic: Enhances lung capacity and endurance.
- Zone 4 (80-90% Max HR) – Anaerobic: Increases lactate threshold and high-intensity performance capacity.
- Zone 5 (90-100% Max HR) – Maximum Effort: Short, intensive sprints designed to build peak power.
Tracking these zones allows you to train intentionally. If your goal is stress relief and longevity, spending time in Zone 2 is key; if your goal is power development, structured intervals into Zone 4 are necessary.
Heart Rate Variability (HRV): The Autonomic Blueprint
While heart rate tracks your average beats per minute, Heart Rate Variability (HRV) measures the specific time variations between consecutive heartbeats, calculated in milliseconds (ms). If your heart rate is 60 BPM, it doesn’t beat exactly once every second. There might be 0.95 seconds between the first two beats, and 1.05 seconds between the next.
This variability is governed by your Autonomic Nervous System (ANS), which is split into two competing branches:
- The Sympathetic Nervous System (Fight or Flight): When you are under stress, this system takes over, demanding a more rigid, metronomic heartbeat (Low HRV).
- The Parasympathetic Nervous System (Rest and Digest): When you are relaxed and recovered, this system signals your heart to respond dynamically to internal needs, resulting in variable timing (High HRV).
A consistently high HRV relative to your personal baseline indicates high resilience, good physical recovery, and stress tolerance. A sudden drop in HRV suggests that your nervous system is overloaded and would benefit from rest.
3. SpO2 Demystified: Tracking Peripheral Blood Oxygen Saturation
Few wearable metrics have garnered as much consumer interest in recent years as SpO2, which stands for Peripheral Capillary Oxygen Saturation. This metric tracks the percentage of oxygen-carrying hemoglobin in your blood relative to the total available hemoglobin.
The Physics of Red and Infrared Light
To read your SpO2, your smart band switches from green light emitters to a dual-light spectrum consisting of Red Light (660nm) and Infrared Light (940nm).
Oxygenated hemoglobin absorbs more infrared light and allows red light to pass through. Deoxygenated hemoglobin does the opposite, absorbing more red light. By calculating the ratio of red to infrared light absorption, the smart band determines your exact blood oxygen saturation percentage.
       [ SPO2 LIGHT REACTION MATRIX ]

     Highly Oxygenated Blood        Deoxygenated Blood
     ┌───────────────────────┐    ┌───────────────────────┐
     │  Passes: Red Light    │    │  Passes: Infrared     │
     │  Absorbs: Infrared    │    │  Absorbs: Red Light   │
     └───────────────────────┘    └───────────────────────┘
     [ Reading: 95% - 100% ]      [ Reading: Below 90% ]
Interpreting Your SpO2 Metrics
- The Optimal Range: For a healthy individual at sea level, a normal SpO2 reading falls securely between 95% to 100%.
- The Alert Zone: Readings that consistently dip below 90% to 92% can indicate hypoxia. If you are training or traveling at high altitudes, your SpO2 will naturally drop as your lungs adapt to thinner air.
- Sleep Disturbances: The most practical application of consumer SpO2 tracking happens overnight. Frequent, sharp drops in your blood oxygen levels while sleeping often signal disrupted breathing patterns, encouraging a conversation with a healthcare professional regarding sleep apnea.
4. Deciphering the Night: Sleep Architecture and Stage Analysis
We spend roughly one-third of our lives asleep, yet until the advent of smart wearables, the quality of that sleep was a mystery. Smart bands use a combination of heart rate monitoring, HRV trends, and wrist movement data (actigraphy) to reconstruct your nightly sleep architecture.
    [ TYPICAL SLEEP STAGE ARCHITECTURE ]

  Awake  ──┐         ┌───────────────┐
           │         │               │
  Light    └─┐     ┌─┘               └─┐
             │     │                   │
  Deep       └───┐ │                   └───┐
                 │ │                       │
  REM            └─┘                       └─┘
         [───────── 90-Minute Cycle ─────────]
The Crucial Stages of Sleep
A healthy night’s sleep is comprised of multiple 90-to-110-minute cycles that alternate through three primary stages:
1. Light Sleep (Stage N1 & N2)
This serves as the transitional gateway of sleep. Your muscles relax, your core body temperature drops, and your brain begins to slow down. Light sleep typically accounts for 50% to 60% of your total sleep duration. While it is often dismissed as less important than deep sleep, light sleep plays a vital role in cellular maintenance and physical transition.
2. Deep Sleep (Slow-Wave Sleep / Stage N3)
This is your body’s physical restoration phase. Your brain waves slow to large, rhythmic delta waves, and your body focuses its energy on cellular repair, tissue growth, muscle building, and immune system rejuvenation. Growth hormones are released primarily during this stage.
- Target: Ideally, deep sleep should make up 15% to 25% of your total sleep duration. If you wake up feeling physically sore or tired despite spending eight hours in bed, your smart band data may reveal a lack of deep sleep.
3. REM (Rapid Eye Movement) Sleep
This is the phase of cognitive restoration and intense dreaming. Your brain becomes highly active, your eyes move rapidly behind closed eyelids, and your skeletal muscles experience temporary paralysis to prevent you from acting out your dreams. REM sleep is critical for processing emotions, consolidating memories, synthesizing new information, and maintaining mental focus.
- Target: REM sleep should ideally account for 20% to 25% of your night. A lack of REM sleep can affect mood management, creative thinking, and focus the following day.
5. Architectural Comparison: Leading Health Metrics Platforms
Different smart band ecosystems emphasize and present these metrics in unique ways. The table below outlines how top brands analyze your physiological signatures:
| Brand Platform | Primary Metrics Highlight | Unique Software Innovations | Best Suited For |
|---|---|---|---|
| Garmin Venu & Vivo series | Stress tracking, real-time HRV, advanced respiratory telemetry. | Body Battery: Combines sleep quality, activity, and stress into an energy score out of 100. | Performance athletes and individuals managing physical fatigue. |
| Fitbit (Google Ecosystem) | Continuous sleep stages, daily skin temperature trends, SpO2 logs. | Daily Readiness Score: Evaluates whether your body is primed for intensive exercise or rest. | Users focusing on sleep health and proactive wellness habits. |
| Xiaomi Smart Band Series | Continuous heart rate monitoring, blood oxygen tracking, PAI activity scores. | Personal Activity Intelligence (PAI): Synthesizes multi-day heart rate data into a single health score. | Value-focused users looking for robust, everyday biometric tracking. |
6. Actionable Implementation: Maximizing Your Sensor Accuracy
To ensure your smart band delivers clean data rather than structural errors, apply these best practices:
- Optimize the Band Fit: For accurate PPG sensor readings, the smart band should sit one finger-width above your wrist bone. It should be snug enough to prevent light leaks during movement, but not tight enough to constrict blood flow.
- Maintain Sensor Cleanliness: Sweat, dead skin cells, and lotion residue can form a film over the sensor glass, diffusing the LED light grid. Wipe down the back of your smart band with a microfiber cloth once a week.
- Establish Consistent Benchmarks: Do not compare your health scores to friends or family. Biometric baselines like HRV and RHR are personal. Evaluate your metrics relative to your own multi-week trends.
- Prioritize Behavioral Context: Treat your smart band data as a guide rather than a clinical diagnosis. If your sleep score is low but you wake up feeling energetic and clear-headed, trust your body’s feedback over the algorithm.
Conclusion
The modern smart band is a powerful tool for wellness tracking. By looking past single data points and understanding trends in your SpO2, heart rate zones, and sleep stages, you can gain a clear view of your body’s physical and mental recovery needs. Use these insights to build healthy habits, optimize your exercise routine, and take a proactive approach to your daily well-being